October 31, 2006

Lost: Agents Find Their Way Home


I rarely watch television. But one show that I really enjoy and regularly watch is Lost. It is a show about a group of castaways, from all walks of life, redefining their lives and trying to find out who they are on an isolated island after a horrific plane crash. In the process, one’s past life does not matter as long as you can make and become who you say you are. An office man with a disability becomes an uber-hunter and leader. An ex-convict is given the opportunity to find his new morality. And most importantly, a shoe shine boy is able to make millions in real estate speculation?

Okay, maybe that last part was inserted by your author but you would think that by looking at the number of real estate agents, everyone decided to castaway their old jobs and ride the housing boom gravy train. Agents, brokers, lenders, construction, and home builders all benefited mightily by the housing boom. In addition, travel agencies and consumer outlets did well too with the newfound equity wealth of many. A virtual ATM had been slapped on to the side of your stucco two-bedroom condo, courtesy of the housing boom. The Los Angeles Times has a real estate section each Sunday, more like a housing propaganda section, but the last few weeks of articles are pointing toward a slowing housing market and are creeping their way into the paper like the tide at your locally polluted beach. This last Sunday they had an article titled “Not an agent’s market either” which talked about the apparent boom and now bust for new real estate agents. Currently there are 510,000+ agents in California. 50 percent of agents have joined the ranks in the last four years according to the article. This would mean that none of these agents have faced a real downturn. Let us read a section in the article describing a recently minted new agent LA Times Article:

“Nuechterlein found the business a tough slog from the get-go. He had a job selling computers for a major chain, earning up to $60,000 a year in commissions, but like so many others he thought he could make an easier buck in real estate.”

Okay, so first we have a case-study of someone earning a middle-income leaving their job to enter real estate. Little did he know that real estate ebbs and flows in cycles Real Estate Cycles from 1800 till Present. But now that the market is shifting he is beginning to rethink his new career choice. Let us look at another statement in the article:

"This is not a get-rich-quick industry," said Jodi Werner, vice president of the Orange-based Pacific West Assn. of Realtors, which predicts a 10% drop in its 14,380-person membership next year. "There is a lot of pressure."

This isn’t a get rich industry? Oh really? Then why are all the Tom Vu late night commercials touting get-rich-quick schemes in real estate? Heck, I even see Donald Trump doing a learning Annex here in Southern California in November. Come on, these talking heads are now doing a good cover your a** (CYA™) technique since they know the market is shifting dramatically. But in real estate, where we are constantly told how limited land and space is, will there be enough of the pie for everyone?

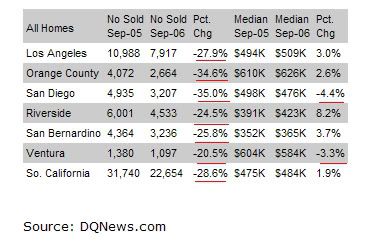
“The air coming out of Southern California's real estate balloon is sending more than a few agents packing. In a business where 15% of the agents make about 85% of the sales, according to industry experts, and the number of sales in California has plummeted 31.7% since September 2005, it's no wonder that rookies and veterans alike are opting out.”

Read that very carefully you aspiring Tom Vu, 15% of the agents make about 85% of the sales. The Pareto principle applies here as well. Italian Economist Vilfredo Pareto observed that 80 percent of tax revenues were received by 20 percent of the Italian population. He went on to conclude in many economical systems that an 80-20 rule would apply. Residential real estate in this country also applies. Again, the facts are pointing toward a declining market and many fail to realize what will happen to these agents when the market dries up completely. Is the well deep enough to maintain these new comers on life support? I doubt it. Then what will happen to the economy? This is the main question. I pointed out in one of my previous posts Realtor Mantra that 40 percent of new jobs are linked to the massive housing boom of the 21st Century.

It is hard to beat a dead horse, hearing the thud of your shoe against his stale skin, but the mainstream media is only starting to point out what many on the housing bear circuit have been purporting for the last year (some even longer). Do people think, like our above case study Nuechterlein that they will be able to waltz right in back to their old job positions? I doubt it especially when an economy is contracting – just look at the latest GDP numbers. Many folks will soon realize that they are lost and will quickly need to redefine themselves. How they will go about this is another topic in itself.

October 26, 2006

Realtor Mantra: Buy Today, buy Tomorrow, buy Yesterday!


Let us warm up our brains and do a visualization activity shall we? Imagine you are in a forest being chased by wild boars. You run through the green and brown shrubbery and hear the grunts of the boars as they follow your scent. Your breathing is intense and you run at full pace toward a light that you see creeping through the forest foliage. As you approach the light, you realize it is heading toward a steep and rocky cliff. The boars are gaining ground. What are you to do? You only have a few minutes and things are getting worse by the second. But then you realize you are a card holding Realtor! And you remember the speech given to you last month about real estate always appreciating and growing branches into the sky! Heck, the speech even went so far to discuss that everything in life given the right mentality goes up like a hydrogen powered German Hindenburg. As you remember this the boars surface, hungry for your flesh. You smile and hold your mantra to your heart and jump with pure glee.

So what is the point of this story? Besides the fact that the boars were only chasing you because you had unopened beef jerky in your left pant pocket the story serves as an example of faulty logic even in the face of imminent danger. Yahoo Finance had a top story today discussing the massive drop in new home prices. The headline reads “Home Prices Plunge by Most in 35 Years” and the article contains this as the opening paragraph:

“The median price of a new home plunged in September by the largest amount in more than 35 years, even as the pace of sales rebounded for a second month.

The Commerce Department reported that the median price for a new home sold in September was $217,100, a drop of 9.7 percent from September 2005. It was the lowest median price for a new home since September 2004 and the sharpest year-over-year decline since December 1970. The weakness in new home prices was even sharper than a 2.5 percent fall in the price of existing homes last month, which had been the biggest drop on record.”

Even in the face of this we get talking heads such as David Lereah, King of all things delusional discussing that the worst is already past for housing. Even Greenspan jumps in by saying real estate has seen the worst, but not yet. Huh? Are we taking notes out of the Karl Rove handbook or are we testing our ability to use Orwellian double-speak? So let us dissect the article. Last month we had a record drop of 2.5 percent reported by the Commerce Department for August housing data. This month, we get a drop of 9.7 percent for September which is four times the amount of the past month. These are year over year figures so this is a trend. By my account, when you break a record two months in a row you have not seen the worst. Anyone who has taken a basic economics class realizes that macro trends take time to filter through the economy. Reversion to the mean at times is slow but at other times can happen very quickly. But listening to these folks is like having a four year old translate a Chinese television program to you in Oxford English and expecting it to be 100 percent accurate.

You are starting to see a paradigm shift. Those associated with housing have had centralized meetings regarding their message.

“How should we address inventory rising?”
“What about year on year price drops?”
“What can we say when home builders are losing 50 percent of their market cap in one year?”

And these brilliant minds of America came up with a slogan that would even baffle Einstein for years. The bust and slow down is already over! Wow! Simple yet so profound. These real men and women of genius decided that their campaign message would be to preempt any bust or down turn talk by already saying that it occurred. Forget the fact that the last six years of real estate appreciation would look like a rocket ship flying off of your Excel spreadsheet. Forget the fact that we are in unprecedented territory and have never witnessed such massive credit expansiveness linked to one industry. Even Bloomberg magazine links 40 percent of recent jobs are somehow related to the current housing boom.

Bloomberg 40 Percent Linked to Housing

But again, why let facts get in the way! These are things of the brain and who wants to waste their time using a worthless organ when you can go with Jim and the Twins and speculate, flip, and use massive credit to become the next Donald Trump. You need to give it to the housing industry for this tactic. They are simply protecting their interest (and livelihood for that matter).

So why is the party only beginning? Let me list a few major reasons:

1. Sky rocketing inventories
2. Massive number of loan resets
3. Buyer and seller psychology

Regarding point one, sky rocketing inventories by simple microeconomic theory will force prices down. Homebuilders have created a massive glut of homes on the market that will continue to saturate 2007. For you mathematicians you can figure out inventories by this very complex Calculus equation:

Homes For Sale – Homes Sold = Remaining Inventory
More homes for sale plus less homes sold equals more inventory! Damn, my head hurts when I do math so let us move on to point two.

This year it was estimated that 500 million in loans reset. Next year it is estimated that 1 trillion (yes, that is a Mr. T) will reset as in 2008. So if so much has gone into reset this year why haven’t we felt the boars teeth in our leg? Because this year, many folks were still able to refinance and unload homes to greater fools. Yet 2007 will prove to be the year were the buck stops for housing. I discuss this in detail in another one of my post so I won’t go into that further. Point three regards market psychology.

Remember the current Yahoo headline? They use the word “plunge” as in “yo, he took a massive plunge on that motocross jump dude.” Or the word conjures up memories of you standing over the porcelain throne plunging away to fix the toilet. Either way, pain or crap, we are in for it and this is only the beginning. Yet listening to real estate agents you would think that today is the absolute greatest day to buy because as the fool you are, you missed out on the equity run. This Johnny come lately mentality worked when year on year gains were in the double-digits. But how do you sell a 9.7 percent drop? Easy! Just say this:

“Hey when I told you the 2.5 percent drop was the lowest ever and prices would go up I was off one month. This 9.7 percent drop IS the real lowest and now we are set to soar to the moon.”

You can modify this script to fit your needs and modify it to incoming figures but you get the point. Market psychology is shifting quick and the mainstream media is now using stronger words in headline stories. There was a story on ABC this week about a couple that didn’t realize there payment had adjusted from $1,700 to $3,800 a month. There explanation? They didn’t read the fine print. The lender didn’t mention a reset happening so soon. Oh, and the lender said boars don’t bite and you can fly as if you were tripping on LSD. Well, they didn’t say that last sentence but at least that would have more semblance of reality than the drivel that they are currently spewing.

October 24, 2006

Ponzi Financing – The House that Credit Built.


Do you know the story of Charles Ponzi? Ponzi was an Italian immigrant and figured out how to use an early form of arbitrage to create money. In a nutshell Ponzi made money by exchanging foreign postal stamps that were fixed and leveraged into favorable currencies. Since Europe was ravaged at the time, many currencies were devalued yet the rate of stamp was never changed. This was all legal. However, Ponzi decided that he would seek out investors and offered them a 50 percent return on their investment in 45 days. You could double your money in 90 days! What did this do? Well after a few successful investments he started to build momentum. Take a look below:

Feb 1920: $5,000
March 1920: $30,000
May 1920: $420,000
July 1920: $1,000,000+

This was the start of the Securities and Exchange Company (sound familiar?). The ironic thing was that Ponzi was losing money daily. The thing that kept him going? Debt. Basically he was paying out his investors with money that was coming in. In fact, so many people bought into the hype that widows were mortgaging their homes to get a piece of the action. When someone from Barron’s decide to examine Ponzi more closely, they realized that the company was completely unsustainable. They realized that 160 million postal coupons would need to be in circulation when only 27,000 were estimated to be in use. By August 13 Ponzi was under arrest. Even at this time, so many people had blind faith in Ponzi that they cried and held anger toward the officers who arrested him. They bought into the dream Ponzi was selling even though economically it had no basis in fundamentals.


“Hello, my name is Charles Ponzi and I approve of the Housing Bubble.”

Looking back nearly 100 years one can easily say “why in the world did people fall for the Ponzi scheme?!” Why look back that far when we can look at our modern day heroes, the flippers and speculators. Again how does this compare? For one thing, many flippers that purchased properties in the last few years did not care that the property would produce a negative cash-flow because they figured a greater fool would purchase the property. Heck, they were fixated on 50 percent gains! Think of it this way, buy a property with $10,000 down, spend $5,000 fixing it up and sell it for a profit of $15,000. So you get your $15,000 back plus $15,000, a net gain of 100 percent. In addition, many flippers held onto property for only a few months thus increasing their yearly gains. So this is all anecdotal right? If you want a real life case study I point you toward Casey, a 24 year old flipper with 2.2 million dollars in debt: www.iamfacingforeclosure.com

And again if you look at recent foreclosure data for the month of October, 50 percent of mortgages that are entering foreclosure originated in 2005 or after and have a median age of 14 months. This is not a homeowner that bought in 2000 and is worried; that is unless he used his home as an ATM machine and did cash-out refinancing. The well is quickly running dry. Washington Mutual reported that 30+ lates noticeably increased in the last few months and their mortgage portfolio has decreased. In addition, they are laying off 9,300 workers. Are these signs of a booming market? Or what about Kara Homes that is now in Chapter 11 bankruptcy? http://www.bloomberg.com/apps/news?pid=20601087&sid=ajY74Kg6RI7o&refer=home

These are only two examples of a financer (WM) and a seller (Kara Homes) that are two sides of the same coin. One cannot do exceptionally well without the other. Now that the Ponzi scheme is starting to unravel and lending is tightening, we will see more caution by buyers and more drastic measures by sellers. Now we will get those that say “are you kidding! I can still get a 125 percent interest only with no money down.” Is this really prudent? Look at the below data by the Mortgage Broker Association:

“As of September 2005, Adjustable rate Mortgages (ARMs) accounted for roughly 70% of the prime mortgage products originated and securitized and 80% of the subprime sector.*”

* 2006 Global Structured Finance Outlook: Economic and Sector-by-Sector Analysis, FITICH RATINGS CREDIT POLICY (New York, N.Y), Jan. 17, 2006 at 12.

Think this is isolated? Look at some data for the Bay Area:

“The following chart shows the percentage of Bay Area loans that were interest only or Option ARMs (know as negative amortization).”**
Year Interest Only Option Arm
2005 42.6% 29.1%
2004 43.7% 9.6%
2003 20.3% 0.8%
2002 12.0% 1.7%
2001 2.9% 1.6%

**Kathleen Pender, Mortgage options explode, SAN FRANCISCO CHRONICLE, April 13, 2006

Like a Ponzi scheme, it is good until it isn’t. Think of it as musical chairs. When chairs are plenty, everyone is having fun. Yet as the music winds down, we know that eventually only one person will be able to sit.

October 23, 2006

Foreclosures? Housing Bubble? In Southern California? Impossible!

Last week DataQuick released quarterly foreclosure numbers for the state of California. If anything the numbers again are pointing to a bursting housing bubble. Take a look at the chart below:


First, DataQuick has an interesting quote in the article accompanying this data:

“The median age of the home loans that went into default last quarter was 14 months, and more than half were originated in 2005.”

More than half of the loans that are currently in the foreclosure stage were originated in 2005. In addition, the median age of loans in default is only 14 months. 14 months! Think home owners did a Gumby and overstretched themselves? Let us dive into three key points from the chart:

1. San Diego is getting hammered. Foreclosures are up 159.9% from the third quarter in 2005. Didn’t get that? San Diego is facing foreclosures up in the 160% range. In raw number terms we have 2,355 homes facing foreclosure where last year we only had 906. Let us run a hypothetical from the article. The average California home foreclosure was 5 months behind ($9,829) with a median mortgage of $306,000. Let us do the numbers above shall we?

2005 3rd Quarter = (906)x($306,000) = $277,236,000
2006 3rd Quarter = (2,355) x ($306,000) = $720,630,000

Even at a low number, many housing head pundits say that the difference between 906 and 2,355 is negligible. Do you think half a billion dollars only in the San Diego area now at risk is negligible?

2. Southern California is up 104.8% in foreclosures. So you are telling me that this isn’t isolated? Nope. This is statewide. Where last year the canary in the mine San Diego was facing pain, now all of Southern California is facing an increasing number of foreclosures. And we are talking a dramatic change.

3. Statewide California is seeing a jump of 111.8% in foreclosures. How this isn’t big news boggles the mind. We currently have 26,705 homes facing foreclosure. Of course there are many stages to foreclosure as listed below:


But the difference now in 2006 as opposed to 2005 is:

• We are in a falling market
• By looking at the data, half of these loans originated during or post 2005. So much for having years and years of equity like many claim.
• Less buyers are in the market
• Many adjustable mortgages are, well adjusting (big surprise)
• Market sentiment is drastically changing
• An X factor as well. Many folks took out HELOC and home loans that have much higher rates. Equity is at all time lows even though appreciation has ramped up to all time highs. An oxymoron yes but foreclosures are through the roof. Like I discussed in a previous post, equity isn’t yours until the certified check is in your hands after escrow is closed!

The market is changing day by day. Fall and winter are slow selling and buying seasons. I’m thinking the big show will be spring and summer of 2007 when many sellers think they will be able to unload their homes at peak prices. Unfortunately like the five year old learning there is no Santa Clause, they will find out the equity bunny is nowhere to be found.

October 20, 2006

Dr. Housing Bubble Examines Patients of the Housing Bubble.

Today we will exam our friend in Normal Heights. Each week I will dissect a property that is overly valued (like what isn’t right now?) and has very little potential of selling at the current listed price. I will offer a prescription to alleviate the pain the housing bubble patient is facing. Today we exam the below San Diego property located in Normal Heights at a very “un-normal” price:


Before we go on some stats regarding the condo:

Price: $579,000
Bedrooms: 3
Full Baths: 3
Partial Baths: 0
Square Feet: 1,677
Lot Size: N/A
Year Built: 2004
Listing Date: 07/01/06
On Market: 111 days
Type: CONDO/TH
Status: ACTIVE

On the listing we find that a previous twin unit sold for $674,000 and the seller is giving us an “instant $100,000” in equity. How generous of them to think of the nice poor buyer! Who in the world gives you $100,000 instantly? Even Howie Mandel makes you sweat on Deal or No Deal before letting a contestant walk away with $90,000 to $110,000 (the average of all contestants by the way). Is what this seller saying true?

Investigating previous sales records, we find that the previous property, which is smaller than this unit sold in 2004 for $492,000. Not sure where they derived their sky high price and instant Cup ‘O Noodles equity? Maybe using the Zillow.com estimate. Regardless, this property has been on the market close to 4 months. We can see that the above patient has what we call “price so high like a retard and drop instantly for effect” syndrome:

Price Reduced: 07/2x/06 -- $649,000 to $599,000
Price Reduced: 09/0x/06 -- $599,000 to $579,000

Yet the first drop had no effect. Now we are quickly approaching winter and what is this seller to do? For one thing, this place is priced like a home but is only a condo. Second, this seller is fibbing since previous sales data is now easily accessible by the public. On the Dr. Housing Bubble scale of housing bubble pain, this one gets a prescription of:


October 19, 2006

C.A.R. says 2007 will see a -2% Drop in California. Does This Feel like a 2% Yearly Drop?


This quote from the L.A. Times article today:

“Now, the housing boom is over, with the slowdown expected to continue next year, according to a new forecast by the state's real estate agents. The median price of an existing California home will decline 2% to $550,000 in 2007 from a projected median price of $561,000 this year, according to the California Assn. of Realtors. Sales are projected to decline 7% to 447,500 units from 481,200 this year.”

Okay, for one thing the C.A.R. has already demonstrated that they were wrong with their $561,000 prediction so why in the world are we to believe their rosy colored scenario of a 2 percent drop in 2007? They are predicting a moderate correction of $11,000 across the state of California. In addition, they are predicting sales dropping off by 7 percent. Are we following two different markets or are we drinking from two different data fountains? For one, sales are down a whopping 30% across the state from last year according to DataQuick. In addition, that two percent drop has already occurred! For example, Southern California has already seen a 2% drop since the peak in June 2006 of $493,000; by the way, we currently stand at $484,000 for those keeping track. For one, the C.A.R. will be wrong since they predicted a double-digit gain this year for the state when most likely, we will hit zero percent or even negative territory by year end. Great source of unbiased information. Did I mention they are an association of agents?

So you want to investigate yourself? You say, this isn’t that bad right? Take a look at ZipRealty. They list 116,391 properties in the Greater L.A. area for sale. Want to guess how many are reduced listings? 48,136! In other words, 41 percent of L.A. county listings have been reduced or "cut" as I like to say. In addition, keep in mind this does not factor in listings that have expired or properties that have been taken off the market. What is also happening is agents are removing properties from the MLS and simply relisting them. So the 41 percent number is a low-ball number.

Now ask yourself this simple question: if the market was so hot why would nearly half of all listings be reduced? Not only that, why have sales dropped 30 percent from last year? Do these numbers line up with the C.A.R.’s glorious predictions?

October 18, 2006

DataQuick News: Much Ado About Nothing?

Many of those interested in Southern California Real Estate prices go to DataQuick Real Estate News. DataQuick is recognized to be one of the most comprehensive databases regarding real estate sales and median price information in California. Of course, since they are part of the real estate machine, much of their revenues come from those in the real estate industry. Each month, normally the third Tuesday of the Month, data comes out for the Southern California market. A couple of anomalies happened this month. One, the data was not released on the normal date but on October 12, nearly a week early. Second and more importantly, DataQuick has changed a very important market indicator statement in their monthly release:

“Indicators of market distress are still at a moderate level.”
October 2006 DataQuick

For the past three years however, meaning a consecutive 36 months the statement read as:

“Indicators of market distress are still largely absent.”
January 2003 DataQuick

Since January of 2003 they have had this statement cemented into their monthly release. In addition, January of 2003 was the first time they decided to word their monthly release in such a format. Now the question that many are asking is since when did DataQuick discuss that the market was showing distress at moderate levels? How can you go from “largely absent” to “still at a moderate level” in one month? Did I smoke peyote last month and slip into a dream where David Lereah was playing nice with TeleTubbies and all of a sudden the market was okay? You can go ahead and verify this yourself by clicking on the below links for October and September so you too can realize you weren't induce by mind altering substances:

October 12 Release: October 12 DQ
September 19 Release: September 12 DQ

Now this may be much ado about nothing but I think this is significant. Since sales data on real estate usually lags two to three months, due to the entire process of escrow, this is in my humble opinion an important change preparing the public for a different market in 2007. Think of the Fed releasing its minutes a few months ago. Once they inserted the holding pattern statement, the bond market went haywire and all of a sudden we drop from a ten-year rate of 5.24 to 4.7, an instant 10 percent drop. Now you may ask who cares right? Keep in mind that DataQuick provides data to the L.A. Times, local news media outlets in San Diego, and the Bay Area so they cover a large part of California. This is what the Dick and Jane consumer digest as a daily meal. If anything, they are seen as the most legit authority regarding real estate data in the state.

Like Don John in Much Ado About Nothing, can it be that someone is trying to put a wrench in everyone’s happiness? Surely those most likely to gain from good news are those closely tied to the real estate arena. But DataQuick has provided data on a down market as well when Southern California homes were being sold for loses:

1995 Archive - 1995 Archive DQNews

Is DataQuick gearing up for another 1992-1995 campaign? Or maybe my eyes deceive me and there is nothing to see here and I should lay off the peyote. So what do you think of this?

October 16, 2006

Income vs. Housing: When Did Housing Become Gold?

Everyone must remember in high school social science class discussing the glorious California Gold Rush. Go west my child was the battle cry of the day! Thousands came to California with the intention of making it big via the gold rush era. Most found dry wells, pilfered mines, and shantytowns. But some made money at that time, tremendous money at that. Think of Levi Strauss & Co.; they made money selling as an auxiliary to the gold rush. People from cowboys to miners needed sturdy work pants and Levi’s were the thing to get. Everyone needed these pants even though they were going broke trying to find gold. In addition, dry food stores were booming because many miners needed quick eats to survive.

This story serves an important lesson. In the last few years during California’s real estate “boom” some people have become extremely wealthy. A new class was completely spawned by the massive appreciation in real estate. Agents, brokers, banks, speculators, Home Depot, Lowes, and construction all boomed to record levels thanks to the massive appreciation in real estate. But like the gold rush over a century ago, many realized that the Midas touch was more smoke and mirrors than substance. Many folks associated with the housing boom will quickly realize that not all that glimmers and shines is gold.

Tying this story into housing, the number one factor in purchasing a home is affordability and this is derived from the local family income. On many blogs, we always hear people throwing out rough numbers and guesses regarding income's relation to housing seeing things such as:

“Income has kept up!”
“Housing and income are both on par so real estate is justified because everyone earns $200,000 a year in Los Angeles.”
“I make $200,000 a year therefore EVERYONE makes this much.”


We’ve heard it all. So I’ve done the leg work and done a side by side analysis of Southern California and the median income of California residents for you. I doubt many will argue with the Census numbers and numbers pulled from DataQuick. Let us now dive into the numbers below:

California (source Census.gov):

Year Median Family Income
2005 = YoY +5.40% $61,476
2004 = YoY +3.17% $58,327
2003 = YoY +0.45% $56,530
2002 $56,276


From the chart above, we can see that the median family income has hovered around $56,000 to $60,000. Overall you can see that in four years income went up only 9.2 percent. Besides that, after taxes, insurance, 401K deductions, the take home net income for these real families hovers around $3,200 a month. Keep in mind the stats above are for FAMILY incomes, not single earner incomes. And the large number of buyers are families so I think these numbers paint a rather important picture. So has income kept pace with real estate appreciation? Let us look at the numbers below:

Source: DataQuick, www.dqnews.com

September 2006 So Cal Median: $484,000 = YoY +1.9%
September 2005 So Cal Median: $475,000 = YoY +16.1%
September 2004 So Cal Median: $409,000 = YoY +22.1%
September 2003 So Cal Median: $335,000 = YoY +20.1%
September 2002 So Cal Median: $279,000 = YoY +18.2%
September 2001 So Cal Median: $236,000 = YoY +10.8%


Not only has real estate out paced income appreciation, in some years the net equity gain was twice the net income of a median family! Let me repeat that in number terms. As we highlighted above, a median family netted and took home about $38,400 per year. From 2003 to 2004 a Southern California median single family home went up by $74,000! It would be one thing if that was an anomaly year but this occurred for 6 years straight. If you want to reframe this, someone sitting in their house earned more equity than TWO combined families in Californian working and earning the median income take home. How is that for perspective?

So has income kept up with housing appreciation? Bottom line is no. Where in the last four years income has gone up only 9.2 percent housing has gone up a whopping 70 percent in Southern California. And housing is local. Why do you think Californians have one of the lowest ownership rates in the country? Look at the chart below:


So the allure of gold is the glitter and glitz. Unfortunately, data isn’t that hot. But if a median family cannot afford a home in their area who are investors going to rent too to cover their cost basis? Who will they sell too when the mine is all out of gold? There is only so much they can increase rents. The data is rather clear about who got wealthy in these last few years. But if you are looking to buy or invest think like Levi did and invest in other areas that feed off the allure. After all, housing since the early 1900s has only gone up at the pace of inflation. I wonder if all those associated with the real estate industry want to purchase some Khaki pants eh?

October 13, 2006

Tell me the Sales Data: You Can’t Handle the Sales Data!

2006 will be known as the year real estate hit the breaks. Many people for one reason or another seem to be astonished that this shift has occurred. But let us look at the data released by DataQuick for September 2006 to see what really is going on:


I’ve underlined the key points that are causing the market to trend lower. On average, sales are off on average by 28.6 percent. In some areas like Orange County we are off 35 percent year over year! That is correct, sales have dropped by an astounding 35 percent and apparently no one seems to care. Add the increase in inventory and many folks pulling off their houses thinking that in spring 2007 things will be better. Guess how may folks are thinking like this? And what do you think will happen when massive inventory hits the market, less buyers appear, and appreciation is now negative?

Now you may ask, why do I have any credibility talking about real estate? Great question. During my undergraduate years, I actually worked two years for a local broker and still have an active real estate license in the state of California. I am no longer in the industry but still have a strong interest in real estate like many of you do. Yes, maybe I’m a wolf in sheep’s clothing but the reality is I transitioned into a very different industry and have a graduate degree. During the time, let us say it was part of the boom years, I was making a decent income for an undergraduate. The licensing test was absolutely the easiest thing I had ever taken – essentially, I bought a Tom Vu self study course and taught myself real estate. The music reminded me of those 80s movies with synthesized music playing in the background. Real estate was fun and there is definitely a lot of potential in the field. And it is very hard to be a good real estate agent so let me tip my hat to those out there. And this will only become harder as there are +510,000 agents in California alone (and still growing by the way).
http://www.dre.ca.gov/stats05_06.htm

But coming back to why the data is so important in what DataQuick has produced. Information now travels much more quickly. Even a few years ago when I was in the industry we did not have places like Zillow or Ziprealty accessible to us. The advantage as a realtor was that we had a stronghold on the MLS and we had previous sales data. Even though previous records are public, how many people are going to go down to their local Registrar to do research? Not many unless you are a serious real estate investor. But with these new tools, you can see that the trend down will accelerate because of ease of information flow. By the way, this is record year over year sales decreases for Southern California. Even the N.A.R. who in the beginning of the year claimed real estate gains of 5 to 10 percent is now recanting; good job considering we are two months from year’s end! I think my 7 year old cousin made that prediction in July so maybe she should get a prize too. You can do your own research digging up their old predictions (thanks to Google cache) but they have pulled or modified their current forecasts.

These numbers are large and in charge like my uncle used to say. They command attention and are a better litmus test of what is to come. If you are looking to buy there is no reason for you to jump in right now. Heck, even rates are holding steady or even going down so don’t let the mantra of “rates will zoom up” scare you. Ultimately housing is about value, equity, security, and location. These things have an economic value and most can understand that the current value is out of whack thus creating a bubble. In a future article I will discuss the massive increase in land value over the last few years as opposed to an increase in housing material costs. A definite marker of housing speculation. Even John Law made out speculating on land in Mississippi until it all went bust. What is your takes on the current market numbers?

October 12, 2006

When will my home cost me an ARM and a leg?

I’m a visual person. If you tell me Earth is round, let me see a big blue globe of the world. Now many folks that make the rounds around the housing blog circuit always see the following post “what about those massive ARMs and subprime loans resetting.” But in reality they have no idea of the magnitude of the adjustment. Some figures are thrown out there normally ranging between 500 billion and 2 trillion dollars. But what are the real numbers behind the adjustments and given that not all mortgages are created equal, what are the percentages per category. This brings us to the very enlightening chart below:


As you can see, 2006 and 2007 will be peak years in terms of subprime and jumbo loans. Given that many of these loans have prepayment penalties many folks will not be able to refinance given the limitation inherent in the loans. The reason we have not seen the impact of the current ARM resets is that the real estate market has been hot. So hot in fact that even with a prepayment penalty many were able to cash out or even sell homes before facing the piper. This circular system keeps working until appreciation stops. Not only that, rates are much higher than they were in 2004. Keep in mind that most ARMs and interest only loans are pegged to short-term rates such as the LIBOR. Basically they go in tandem with the feds short-term rates.

This is important because another argument you will hear is the fact that the 30 year rate is trending down. Now, this is another important issue to consider. Why would 70 percent of California use interest only, ARMs, or option only mortgagees this last year if rates were so attractive? Because they cannot afford the homes! This party is now over as is demonstrated by the massive decrease via our canary in the mine, San Diego:

http://www.signonsandiego.com/news/business/20061011-1231-bn11homes.html

The drop is 4.5 percent year over year and DOUBLE of the 2.2 percent loss we had in August of 2006. Leverage is a beautiful thing, like looking at a reddish sunset over the desert. When things are going good, you can get wealthy very quick. When things go down however, leverage works just as fast in the opposite direction. By looking at the above chart, we have yet to see what will happen when appreciation takes a quick exit on the 405 to depreciation, inventory numbers explode, and rate resets happen to many unsuspecting homeowners. I believe many of these homeowners assume they’ll be able to sell their home believing 20 percent year over year increase are cemented into the equation. Even if the market stays flat, where will they come up with the average 6 percent commission to market and sell the home? This question will be answered next year and hopefully it’ll only cost one ARM and no leg.

October 11, 2006

San Diego Down 4.5 percent YOY - or $42,000 from Peak.

Does anyone notice how the media has been avoiding actual nominal drops in prices? Instead they rather use percentages because somehow this softens the actual reality. I give credit to the following article for posting some actual facts:

http://www.signonsandiego.com/news/business/20061011-1231-bn11homes.html

In real dollar terms the loss from peak is $42,000. Not a small amount by any stretch. In addition, if you were to sell and bought at the $518,000 peak, you would also be out the additional 6 percent especially in the current buyers market.

Overall the loss would be over $70,000. Forget about money saving renting over buying for the two years and trying to find a buyer at $476,000.

Many have seen the Moody's article that claimed we would see a bottom at -8 percent. Uh, we're going to hit that in November or December not 2008.

Sorry but I have a feeling that the drop will be a lot larger than many have imagined.