This story serves an important lesson. In the last few years during California’s real estate “boom” some people have become extremely wealthy. A new class was completely spawned by the massive appreciation in real estate. Agents, brokers, banks, speculators, Home Depot, Lowes, and construction all boomed to record levels thanks to the massive appreciation in real estate. But like the gold rush over a century ago, many realized that the Midas touch was more smoke and mirrors than substance. Many folks associated with the housing boom will quickly realize that not all that glimmers and shines is gold.
Tying this story into housing, the number one factor in purchasing a home is affordability and this is derived from the local family income. On many blogs, we always hear people throwing out rough numbers and guesses regarding income's relation to housing seeing things such as:
“Income has kept up!”
“Housing and income are both on par so real estate is justified because everyone earns $200,000 a year in Los Angeles.”
“I make $200,000 a year therefore EVERYONE makes this much.”
We’ve heard it all. So I’ve done the leg work and done a side by side analysis of Southern California and the median income of California residents for you. I doubt many will argue with the Census numbers and numbers pulled from DataQuick. Let us now dive into the numbers below:
California (source Census.gov):
Year Median Family Income
2005 = YoY +5.40% $61,476
2004 = YoY +3.17% $58,327
2003 = YoY +0.45% $56,530
2002 $56,276
From the chart above, we can see that the median family income has hovered around $56,000 to $60,000. Overall you can see that in four years income went up only 9.2 percent. Besides that, after taxes, insurance, 401K deductions, the take home net income for these real families hovers around $3,200 a month. Keep in mind the stats above are for FAMILY incomes, not single earner incomes. And the large number of buyers are families so I think these numbers paint a rather important picture. So has income kept pace with real estate appreciation? Let us look at the numbers below:
Source: DataQuick, www.dqnews.com
September 2006 So Cal Median: $484,000 = YoY +1.9%
September 2005 So Cal Median: $475,000 = YoY +16.1%
September 2004 So Cal Median: $409,000 = YoY +22.1%
September 2003 So Cal Median: $335,000 = YoY +20.1%
September 2002 So Cal Median: $279,000 = YoY +18.2%
September 2001 So Cal Median: $236,000 = YoY +10.8%
Not only has real estate out paced income appreciation, in some years the net equity gain was twice the net income of a median family! Let me repeat that in number terms. As we highlighted above, a median family netted and took home about $38,400 per year. From 2003 to 2004 a Southern California median single family home went up by $74,000! It would be one thing if that was an anomaly year but this occurred for 6 years straight. If you want to reframe this, someone sitting in their house earned more equity than TWO combined families in Californian working and earning the median income take home. How is that for perspective?
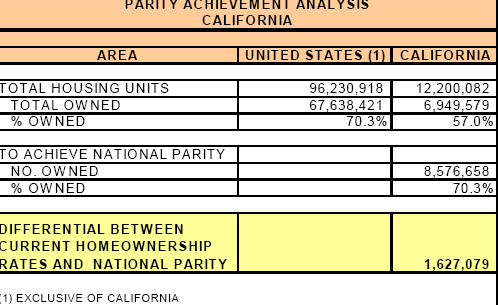
So has income kept up with housing appreciation? Bottom line is no. Where in the last four years income has gone up only 9.2 percent housing has gone up a whopping 70 percent in Southern California. And housing is local. Why do you think Californians have one of the lowest ownership rates in the country? Look at the chart below:

So the allure of gold is the glitter and glitz. Unfortunately, data isn’t that hot. But if a median family cannot afford a home in their area who are investors going to rent too to cover their cost basis? Who will they sell too when the mine is all out of gold? There is only so much they can increase rents. The data is rather clear about who got wealthy in these last few years. But if you are looking to buy or invest think like Levi did and invest in other areas that feed off the allure. After all, housing since the early 1900s has only gone up at the pace of inflation. I wonder if all those associated with the real estate industry want to purchase some Khaki pants eh?
Filed in: housing-data real-estate mortgages mainstream-media

 Digg This!
 Add to Reddit!
 Save to del.icio.us!
9 Comments:
Great blog. Do you happen to know what the ratio of income/home price is? Not sure if there are historical data on that.
Well put and I'm wondering what fundamentals of economy that Alan Greenspan was using in predicting housing market. Perhaps, Alan Greenspan was not from the planet Earth.
Every time I feel the need to shed a tear over my mortgage, I always think of those in California who have it much, much worse.
Glad we can bring some perspective to you Caroline! Just wait until many California mortgages reset in the next two years.
1,627,079
That's one hell of a lot of empty houses/condos..
1,627,079
That's one hell of a lot of empty houses/condos..
Bubble_watcher:
This again strikes at affordability issues in California. Given the current market and even the C.A.R. predicting a negative year in 2007, I'm expecting 2007 to be an interesting year.
I will be adding links to you on a regular basis:
http://millionairenowbook.blogspot.com/2006/10/real-estate-news-and-housing-bubble.html
Shouldn't a higher "non-owned" rate be a good thing for agents and brokers? It is my understanding that on average, rental properties are sold more often than owner-occupied homes (probably due to tax-optimizing landlords holding for shorter terms and then exchanging). Higher sales velocity should be good for those who make money from sales. Or is the perceived problem that the sales commissions will not be broadly distributed among agents and brokers, but rather wind up in the hands of a few?
Post a Comment