October 16, 2006

Income vs. Housing: When Did Housing Become Gold?

Everyone must remember in high school social science class discussing the glorious California Gold Rush. Go west my child was the battle cry of the day! Thousands came to California with the intention of making it big via the gold rush era. Most found dry wells, pilfered mines, and shantytowns. But some made money at that time, tremendous money at that. Think of Levi Strauss & Co.; they made money selling as an auxiliary to the gold rush. People from cowboys to miners needed sturdy work pants and Levi’s were the thing to get. Everyone needed these pants even though they were going broke trying to find gold. In addition, dry food stores were booming because many miners needed quick eats to survive.

This story serves an important lesson. In the last few years during California’s real estate “boom” some people have become extremely wealthy. A new class was completely spawned by the massive appreciation in real estate. Agents, brokers, banks, speculators, Home Depot, Lowes, and construction all boomed to record levels thanks to the massive appreciation in real estate. But like the gold rush over a century ago, many realized that the Midas touch was more smoke and mirrors than substance. Many folks associated with the housing boom will quickly realize that not all that glimmers and shines is gold.

Tying this story into housing, the number one factor in purchasing a home is affordability and this is derived from the local family income. On many blogs, we always hear people throwing out rough numbers and guesses regarding income's relation to housing seeing things such as:

“Income has kept up!”
“Housing and income are both on par so real estate is justified because everyone earns $200,000 a year in Los Angeles.”
“I make $200,000 a year therefore EVERYONE makes this much.”


We’ve heard it all. So I’ve done the leg work and done a side by side analysis of Southern California and the median income of California residents for you. I doubt many will argue with the Census numbers and numbers pulled from DataQuick. Let us now dive into the numbers below:

California (source Census.gov):

Year Median Family Income
2005 = YoY +5.40% $61,476
2004 = YoY +3.17% $58,327
2003 = YoY +0.45% $56,530
2002 $56,276


From the chart above, we can see that the median family income has hovered around $56,000 to $60,000. Overall you can see that in four years income went up only 9.2 percent. Besides that, after taxes, insurance, 401K deductions, the take home net income for these real families hovers around $3,200 a month. Keep in mind the stats above are for FAMILY incomes, not single earner incomes. And the large number of buyers are families so I think these numbers paint a rather important picture. So has income kept pace with real estate appreciation? Let us look at the numbers below:

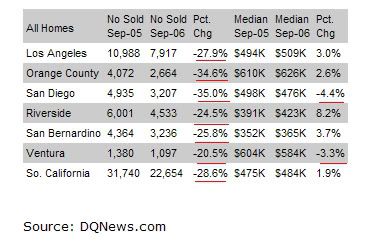
Source: DataQuick, www.dqnews.com

September 2006 So Cal Median: $484,000 = YoY +1.9%
September 2005 So Cal Median: $475,000 = YoY +16.1%
September 2004 So Cal Median: $409,000 = YoY +22.1%
September 2003 So Cal Median: $335,000 = YoY +20.1%
September 2002 So Cal Median: $279,000 = YoY +18.2%
September 2001 So Cal Median: $236,000 = YoY +10.8%


Not only has real estate out paced income appreciation, in some years the net equity gain was twice the net income of a median family! Let me repeat that in number terms. As we highlighted above, a median family netted and took home about $38,400 per year. From 2003 to 2004 a Southern California median single family home went up by $74,000! It would be one thing if that was an anomaly year but this occurred for 6 years straight. If you want to reframe this, someone sitting in their house earned more equity than TWO combined families in Californian working and earning the median income take home. How is that for perspective?

So has income kept up with housing appreciation? Bottom line is no. Where in the last four years income has gone up only 9.2 percent housing has gone up a whopping 70 percent in Southern California. And housing is local. Why do you think Californians have one of the lowest ownership rates in the country? Look at the chart below:


So the allure of gold is the glitter and glitz. Unfortunately, data isn’t that hot. But if a median family cannot afford a home in their area who are investors going to rent too to cover their cost basis? Who will they sell too when the mine is all out of gold? There is only so much they can increase rents. The data is rather clear about who got wealthy in these last few years. But if you are looking to buy or invest think like Levi did and invest in other areas that feed off the allure. After all, housing since the early 1900s has only gone up at the pace of inflation. I wonder if all those associated with the real estate industry want to purchase some Khaki pants eh?

October 13, 2006

Tell me the Sales Data: You Can’t Handle the Sales Data!

2006 will be known as the year real estate hit the breaks. Many people for one reason or another seem to be astonished that this shift has occurred. But let us look at the data released by DataQuick for September 2006 to see what really is going on:


I’ve underlined the key points that are causing the market to trend lower. On average, sales are off on average by 28.6 percent. In some areas like Orange County we are off 35 percent year over year! That is correct, sales have dropped by an astounding 35 percent and apparently no one seems to care. Add the increase in inventory and many folks pulling off their houses thinking that in spring 2007 things will be better. Guess how may folks are thinking like this? And what do you think will happen when massive inventory hits the market, less buyers appear, and appreciation is now negative?

Now you may ask, why do I have any credibility talking about real estate? Great question. During my undergraduate years, I actually worked two years for a local broker and still have an active real estate license in the state of California. I am no longer in the industry but still have a strong interest in real estate like many of you do. Yes, maybe I’m a wolf in sheep’s clothing but the reality is I transitioned into a very different industry and have a graduate degree. During the time, let us say it was part of the boom years, I was making a decent income for an undergraduate. The licensing test was absolutely the easiest thing I had ever taken – essentially, I bought a Tom Vu self study course and taught myself real estate. The music reminded me of those 80s movies with synthesized music playing in the background. Real estate was fun and there is definitely a lot of potential in the field. And it is very hard to be a good real estate agent so let me tip my hat to those out there. And this will only become harder as there are +510,000 agents in California alone (and still growing by the way).
http://www.dre.ca.gov/stats05_06.htm

But coming back to why the data is so important in what DataQuick has produced. Information now travels much more quickly. Even a few years ago when I was in the industry we did not have places like Zillow or Ziprealty accessible to us. The advantage as a realtor was that we had a stronghold on the MLS and we had previous sales data. Even though previous records are public, how many people are going to go down to their local Registrar to do research? Not many unless you are a serious real estate investor. But with these new tools, you can see that the trend down will accelerate because of ease of information flow. By the way, this is record year over year sales decreases for Southern California. Even the N.A.R. who in the beginning of the year claimed real estate gains of 5 to 10 percent is now recanting; good job considering we are two months from year’s end! I think my 7 year old cousin made that prediction in July so maybe she should get a prize too. You can do your own research digging up their old predictions (thanks to Google cache) but they have pulled or modified their current forecasts.

These numbers are large and in charge like my uncle used to say. They command attention and are a better litmus test of what is to come. If you are looking to buy there is no reason for you to jump in right now. Heck, even rates are holding steady or even going down so don’t let the mantra of “rates will zoom up” scare you. Ultimately housing is about value, equity, security, and location. These things have an economic value and most can understand that the current value is out of whack thus creating a bubble. In a future article I will discuss the massive increase in land value over the last few years as opposed to an increase in housing material costs. A definite marker of housing speculation. Even John Law made out speculating on land in Mississippi until it all went bust. What is your takes on the current market numbers?

October 12, 2006

When will my home cost me an ARM and a leg?

I’m a visual person. If you tell me Earth is round, let me see a big blue globe of the world. Now many folks that make the rounds around the housing blog circuit always see the following post “what about those massive ARMs and subprime loans resetting.” But in reality they have no idea of the magnitude of the adjustment. Some figures are thrown out there normally ranging between 500 billion and 2 trillion dollars. But what are the real numbers behind the adjustments and given that not all mortgages are created equal, what are the percentages per category. This brings us to the very enlightening chart below:


As you can see, 2006 and 2007 will be peak years in terms of subprime and jumbo loans. Given that many of these loans have prepayment penalties many folks will not be able to refinance given the limitation inherent in the loans. The reason we have not seen the impact of the current ARM resets is that the real estate market has been hot. So hot in fact that even with a prepayment penalty many were able to cash out or even sell homes before facing the piper. This circular system keeps working until appreciation stops. Not only that, rates are much higher than they were in 2004. Keep in mind that most ARMs and interest only loans are pegged to short-term rates such as the LIBOR. Basically they go in tandem with the feds short-term rates.

This is important because another argument you will hear is the fact that the 30 year rate is trending down. Now, this is another important issue to consider. Why would 70 percent of California use interest only, ARMs, or option only mortgagees this last year if rates were so attractive? Because they cannot afford the homes! This party is now over as is demonstrated by the massive decrease via our canary in the mine, San Diego:

http://www.signonsandiego.com/news/business/20061011-1231-bn11homes.html

The drop is 4.5 percent year over year and DOUBLE of the 2.2 percent loss we had in August of 2006. Leverage is a beautiful thing, like looking at a reddish sunset over the desert. When things are going good, you can get wealthy very quick. When things go down however, leverage works just as fast in the opposite direction. By looking at the above chart, we have yet to see what will happen when appreciation takes a quick exit on the 405 to depreciation, inventory numbers explode, and rate resets happen to many unsuspecting homeowners. I believe many of these homeowners assume they’ll be able to sell their home believing 20 percent year over year increase are cemented into the equation. Even if the market stays flat, where will they come up with the average 6 percent commission to market and sell the home? This question will be answered next year and hopefully it’ll only cost one ARM and no leg.

October 11, 2006

San Diego Down 4.5 percent YOY - or $42,000 from Peak.

Does anyone notice how the media has been avoiding actual nominal drops in prices? Instead they rather use percentages because somehow this softens the actual reality. I give credit to the following article for posting some actual facts:

http://www.signonsandiego.com/news/business/20061011-1231-bn11homes.html

In real dollar terms the loss from peak is $42,000. Not a small amount by any stretch. In addition, if you were to sell and bought at the $518,000 peak, you would also be out the additional 6 percent especially in the current buyers market.

Overall the loss would be over $70,000. Forget about money saving renting over buying for the two years and trying to find a buyer at $476,000.

Many have seen the Moody's article that claimed we would see a bottom at -8 percent. Uh, we're going to hit that in November or December not 2008.

Sorry but I have a feeling that the drop will be a lot larger than many have imagined.